Spectral Interactions of Greenhouse Gases and Clouds
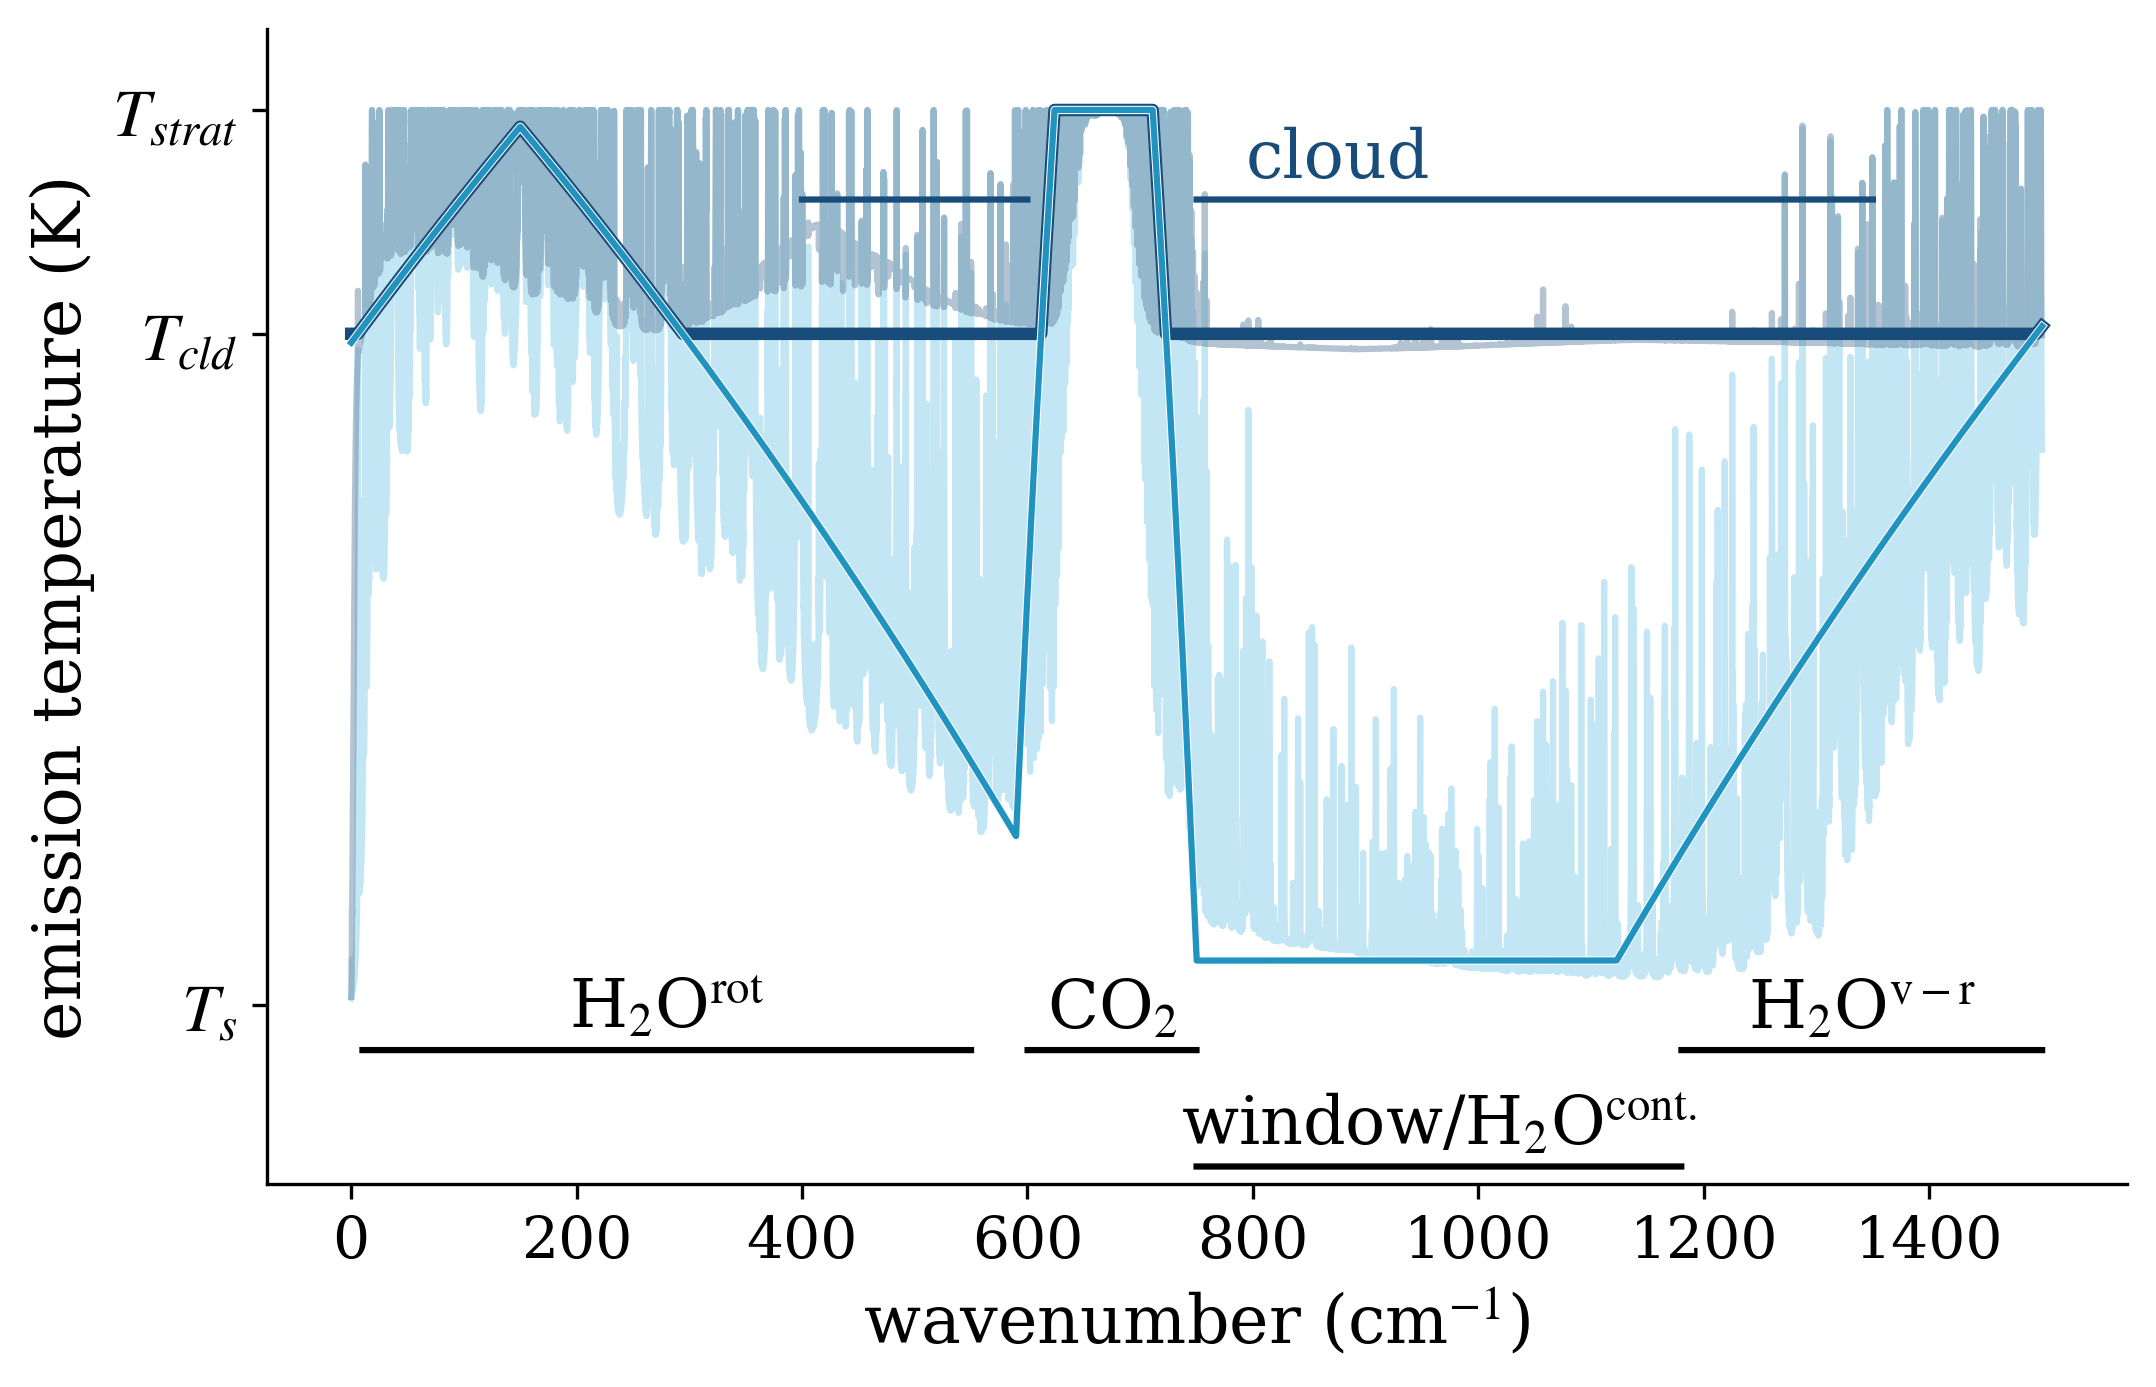
Schematic representation of how clouds and gases share the longwave spectrum. The idealized spectral longwave emission temperature in a clear atmosphere (blue) and a cloudy one (grey) are plotted over full-detail line-by-line calculations. The broadband cloud radiative effect is the area between the two curves; a similar calculation with a changing greenhouse gas emission temperature would yield the forcing. Wavenumber bands dominated by emission by a given constituent are marked below the plot.
The spectral distribution of outgoing longwave radiation (OLR) is determined by which atmospheric constituent first becomes optically thick when viewed from above (CO2, water vapor, or cloud); in the portion of the spectrum where no gas or cloud is visible, optically-thin gases such as ozone-depleting substances can exert a sizeable radiative forcing. Using pencil-and-paper models for the spectral variation of OLR, we disentangle the effects of surface temperature, cloud top temperature, relative humidity, and optically-thin gases on Earth’s longwave energy balance. Our expressions yield understanding of physical phenomena: for instance, radiative forcing by optically-thin gases is linear in the concentration of the gas because the forcing across this portion of the spectrum is of approximately the same order of magnitude, and changes in water vapor and CO2 emission temperature can provide a stabilizing response to warming surface temperatures (cloudy-sky feedback) even in cloudy columns with unchanging clouds.
Pre-print: Paulina Czarnecki and Robert Pincus. ESSOAR.
Science Team at the WCRP km-scale Hackathon.
Paper: Paulina Czarnecki, Lorenzo M. Polvani, and Robert Pincus, 2025. doi:10.1175/JCLI-D-25-0233.1.
Talk: at the Equilibrium Climate Sensitivity (ECS) Symposium.
Data-Driven Quadrature for Broadband Spectral Integration
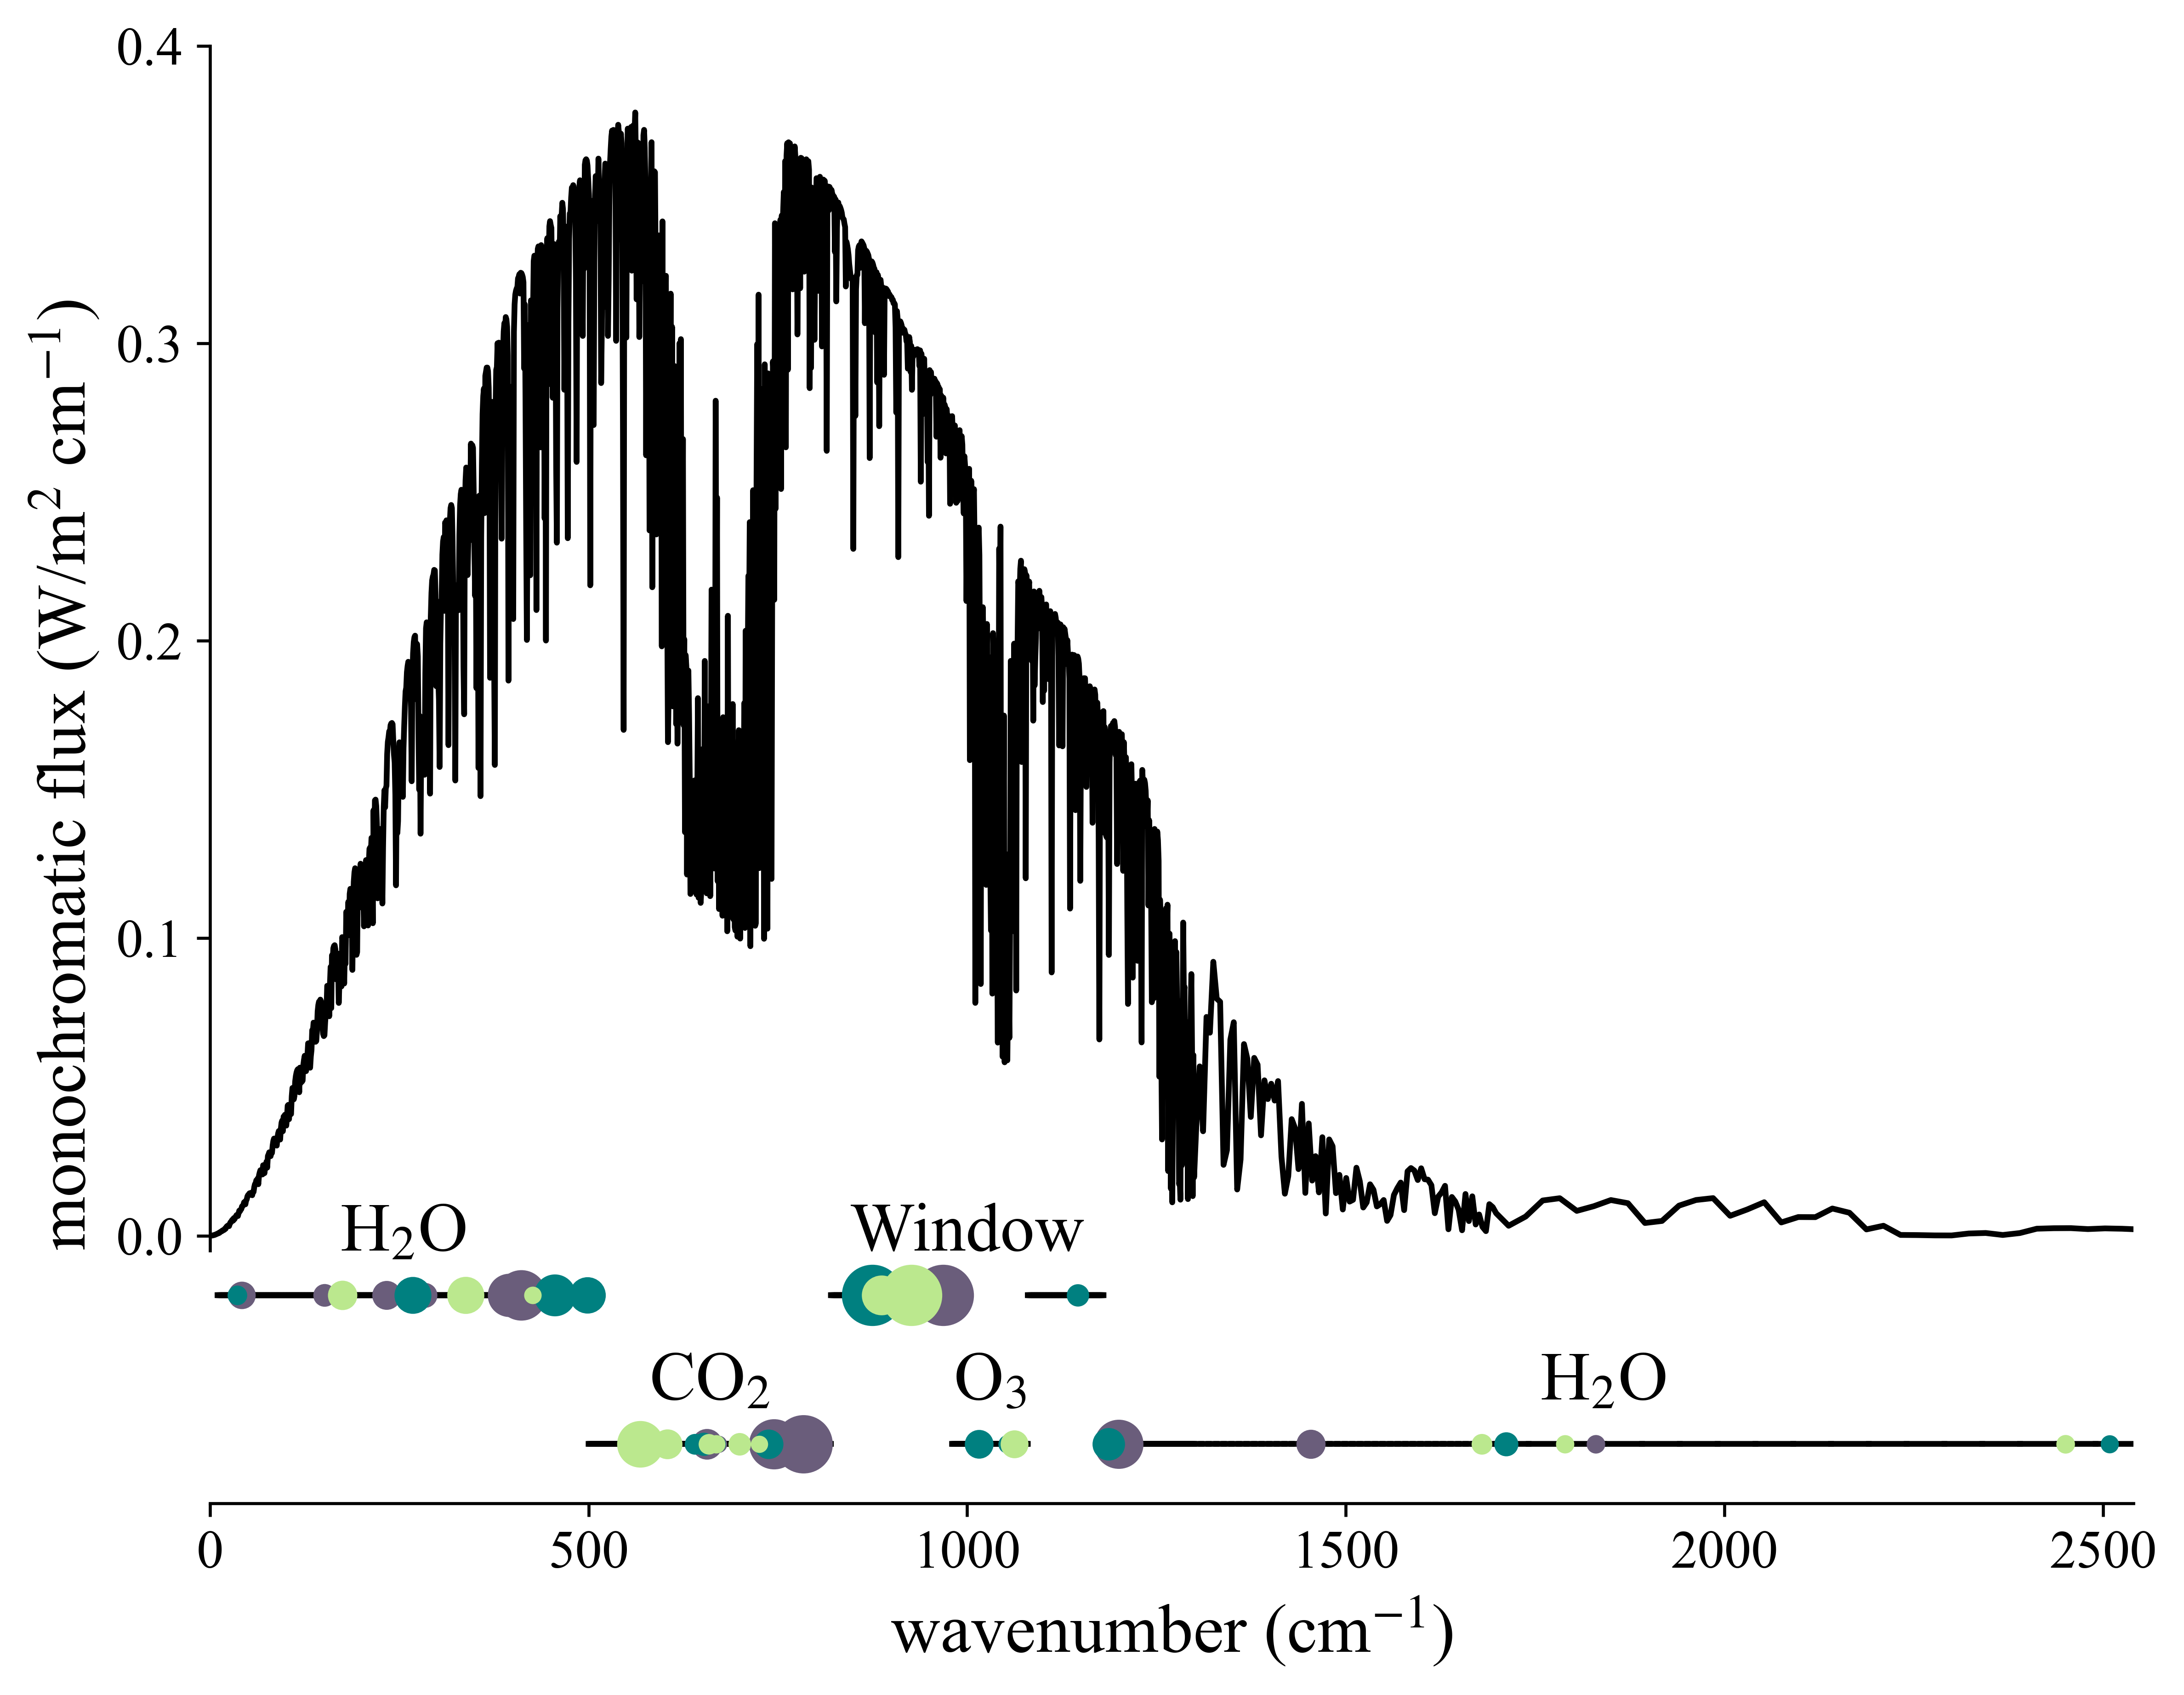
Below an example of a spectrum of outgoing longwave radiation, major absorbers are noted. Dots mark the members of three independent, optimal wavenumber subsets. The colors correspond to these independent optimizations. The size of the dots is proportional to the importance of that spectral point to the broadband flux integration.
Integrating radiative flux across the electromagnetic spectrum, though integral to weather and climate modelling, is computationally expensive; existing parameterizations are fast and accurate but are difficult to understand and implement. As an alternative, we propose Data-Driven Quadrature: we optimize a small set of spectral points and associated weights so that the weighted sum of the monochromatic flux at these points is equal to the total integrated flux. Our method can accurately reproduce flux and heating rate profiles in present-day conditions and radiative forcing by CO2 in the longwave. We are extending the method to the shortwave as well as variability by a wide range of greenhouse gases.
Paper: Paulina Czarnecki, Lorenzo M. Polvani, and Robert Pincus, 2023. doi:10.1029/2023MS003819.
Python package: code to perform your own quadrature optimization, wrapped into a package by Neal Ma. github | pypi
In konrad: implemented as an optional shortwave and longwave scheme in single-column radiative convective equilibrium model konrad.
github | pypi | konrad + DDQ documentation
In ARTS: released as a fast scheme alongside line-by-line radiative transfer code ARTS. github | website | paper | Python module
Pre-Doctoral Work
During the American Institute of Mathematics' workshop on dynamics and COVID-19, I worked with several other graduate students to investigate the statistical relationship between air pollutants and COVID-19 transmission.
Paper: Laura Albrecht, Paulina Czarnecki, and Bennet Sakelaris, 2021. doi:10.6339/21-JDS1010
As an undergraduate student, I worked with Michal Zochowski and his research group to study dynamics in a neuronal network.
Paper: Paulina Czarnecki, Jack Lin, Sara Aton, and Michal Zochowski, 2021. doi:10.3389/fnetp.2021.759131